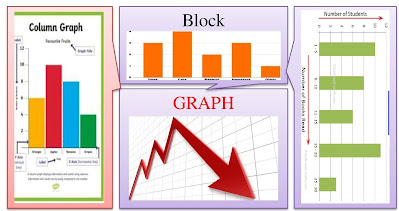
Lesson Planning of Block, Column, and Bar Graphs Subject Mathematics Grade 5th

Lesson Planning of Block, Column, and Bar Graphs Subject Mathematics Grade 5 th Students` Learning Outcomes Draw blocks graphs or column graphs. Read a simple bar graph given in horizontal and vertical form. Interpret a simple bar graph given in horizontal and vertical form. Define and organize a given data. Information for Teachers A bar graph is a graph with rectangular bars with lengths proportional to the values that they represent. The bar can be plotted vertically or horizontally. It has a graph label and vertical line called “Y- axis” and horizontal line called “X-axis”. Each line has a relevant label. Value of both axis starts from “0” The height of the bars depends on the value which they represent. A column graph is a graph which is used in organizing and displaying categorically data. A Block Graph is a simple chart which displays units of data with blocks. Block Graphs have two axes and are a common method of recording information in Math...


